Opening the Analytics tab
- Navigate to the expert detail page at
/experts/<id>(or open the expert from the marketplace and click its name). - Select the Analytics tab in the tab strip near the top of the page.
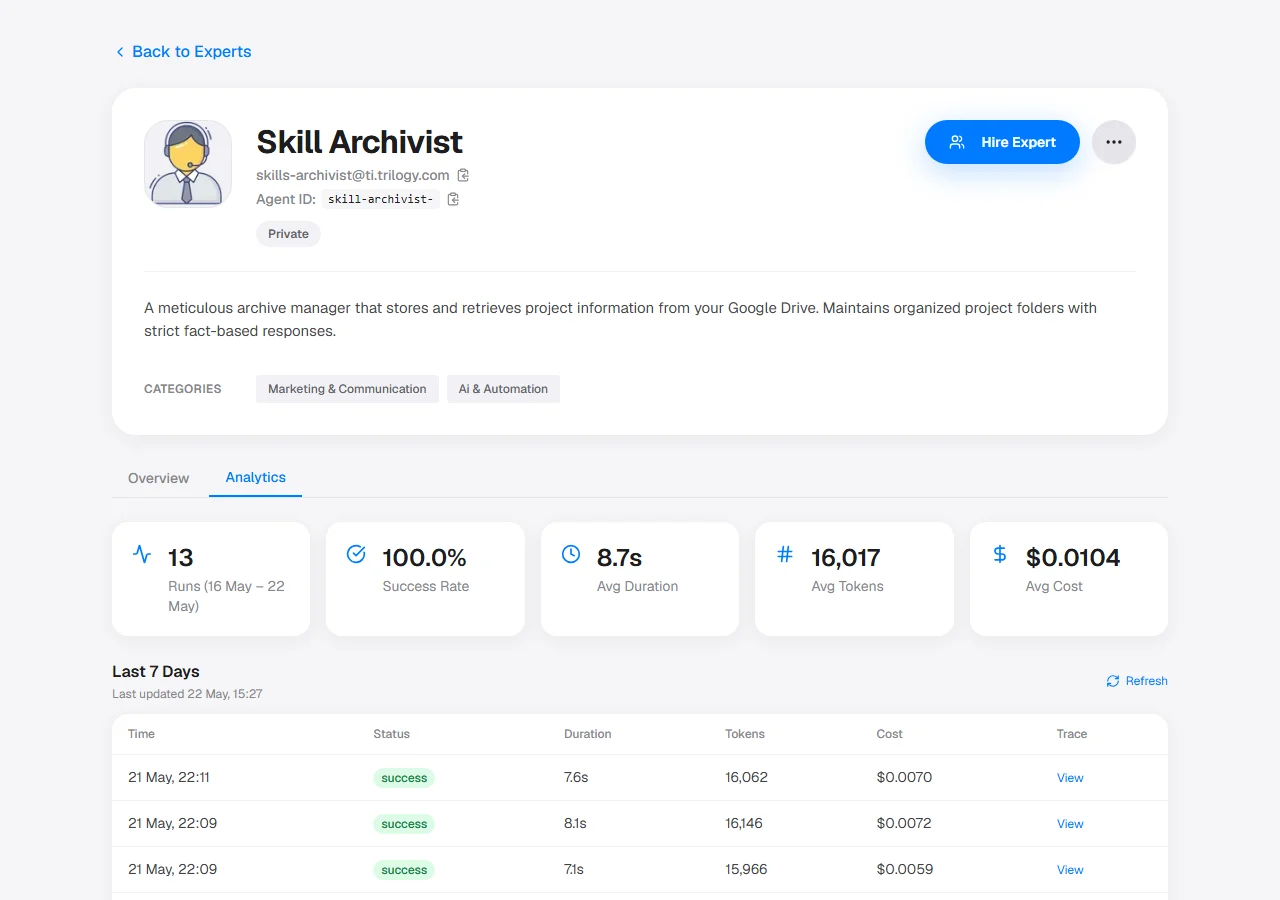
The expert detail page with the Analytics tab selected, showing the run list and status-badge column.
Run list
The run list displays one row per invocation. Each row includes:
Use the View button in the rightmost column to open the run detail drawer for any row that has it. Rows are sorted newest-first. Use the run list to identify failing or slow invocations at a glance.
Status badges
Each run is labeled with a status badge indicating its outcome. The possible values are:A run that times out at the platform level is recorded as
failed with an explanatory error message in the run detail drawer.Run detail drawer
Click View on any row in the run list to open the Run detail drawer on the right side of the page. The drawer displays full metadata for that invocation:- Request ID and status badge
- Started-at timestamp and duration
- Input message sent to the expert
- Output produced by the expert (if the run succeeded)
- Error message (if the run failed)
- Thread token (if the run was part of a multi-turn conversation)
If the trace contains more child runs than can be loaded into the timeline, the drawer shows the message: “Trace has more child runs than we could load — timeline shows the first 300 only.” Only the first 300 child runs are rendered; deeper subtrees are truncated.
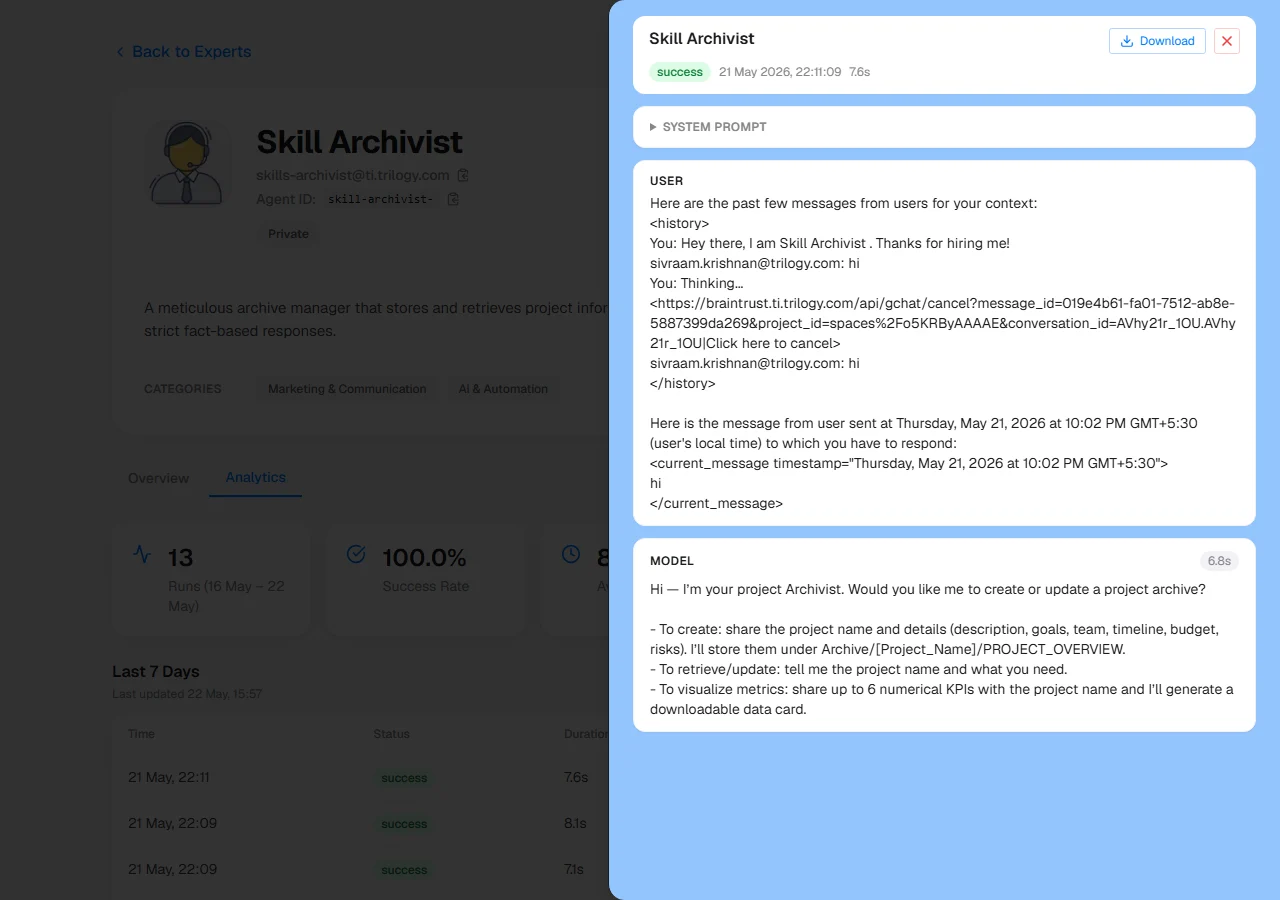
The run detail drawer opened over the run list, showing run metadata, status badge, and the close affordance.
Next steps
Talking to Your Expert
Send messages and manage conversations with an expert.
API Reference — Invoke an Expert
Invoke experts programmatically and retrieve run status via the REST API.